Whether you're juggling client work, managing a growing team, or simply trying to stay ahead of your pipeline, having speedy access to the right insights makes all the difference. We’re excited to unveil our advanced reporting dashboards — a powerful new way to view your Capsule CRM data through a sharper, more strategic lens.
With these new dashboards, Capsule transforms your activity, sales, and performance data into clear, visual insights you can act on. No spreadsheets, no digging: just everything you need to make smarter decisions, faster.
Why reporting dashboards make a difference
Advanced Reports help you:
- Spot risks and opportunities before they snowball
- Coach your team more effectively using real data
- Forecast and plan with confidence
- Track what’s working (and what’s not) across your business
Whether you’re leading a consultancy, growing a sales team, or running your business solo, our reporting dashboard puts the answers at your fingertips.
What kind of dashboards can I use?
We’ve added even more reporting capabilities to the Capsule CRM dashboard. In addition to the existing sales tracking reports, you can take advantage of six core dashboards, each designed to answer specific questions and support better decisions.
Let’s explore the uses and takeaways of each dashboard.
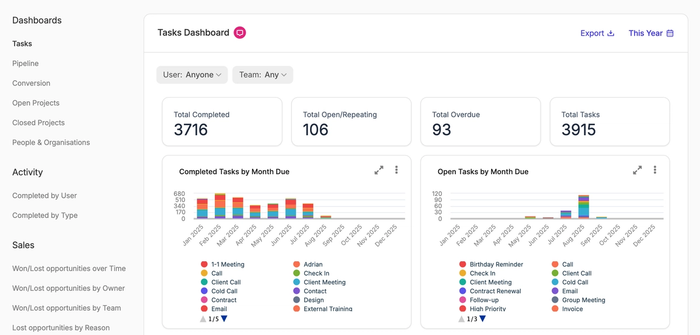
The Task dashboard
Get more insight into what’s getting done and what’s slipping. You can break it down by user to better understand team capacity, workload balance, and individual performance.
The Task dashboard also makes it easy to spot overdue or recurring tasks, which may point to pitfalls or blockers in your team and its processes.
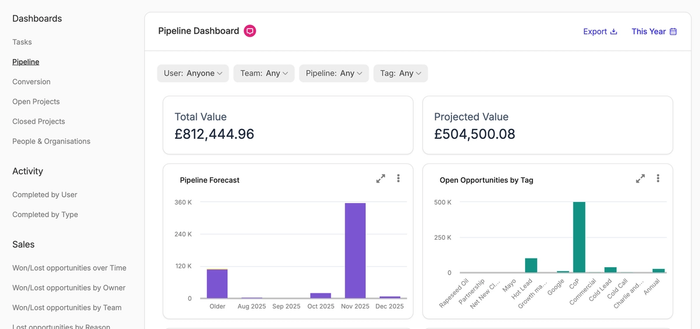
The Pipeline dashboard
Instantly understand your total pipeline value and forecast income by month, so you can quickly determine your team’s performance. You can also use this to spot seasonality to plan your outreach and marketing more accurately.
Using Tags, you can identify your most valuable contacts and open opportunities, as well as determine your high-performing service lines.
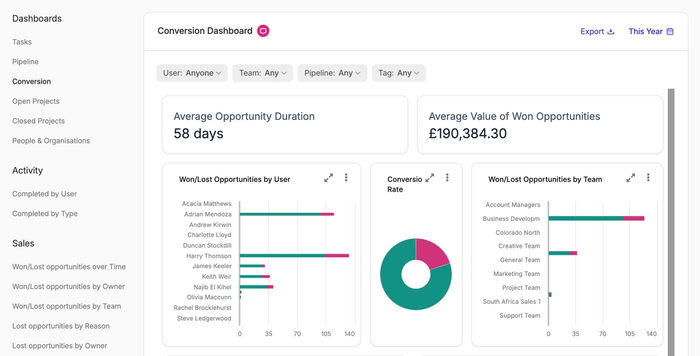
The Conversion dashboard
Use this dashboard to track conversion rates across your clients’ industries and regions, as well as your team members.
Here, you can also see your average deal duration and the value of the Opportunities you win.
It’s great for pinpointing where proposals stall and who’s closing deals fastest.
The People & Organizations dashboard
Admins and Business Development Managers can take advantage of this opportunity to view how many new contacts are being added, to help divide up work between the team and offer forecasts to senior management.
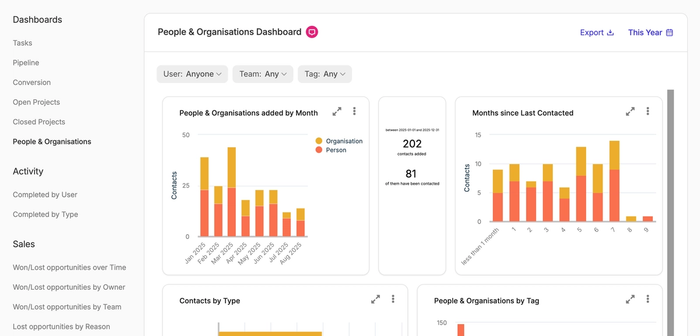
Here, you can segment your audience with filters like region and last contacted date. You can also spot outdated records or under-engaged leads, helping drive decisions to change outreach strategy or simply clean up your CRM.
Discover the importance of data hygiene in your CRM.
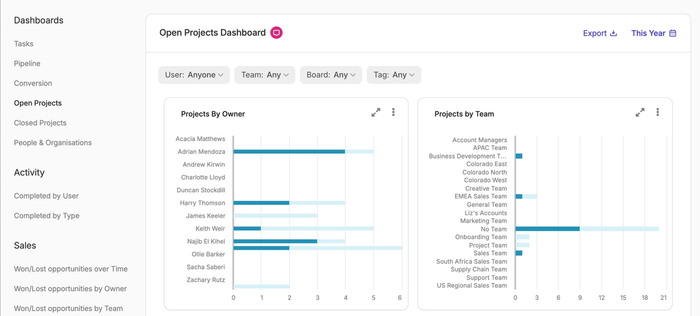
The Open Projects dashboard
Use the Open Projects dashboard to track in-progress projects by owner and team. With this clarity, you can balance your team and each individual’s workload, as well as align these efforts with departmental and company-wide objectives.
Likewise, you can visualize open projects across different boards to compare the delivery value. If you offer a variety of services, this is useful for highlighting your real breadwinners.
The Closed Projects dashboard
Here, you can determine the time it takes to deliver different projects. So you can quickly understand which services close quickly or consistently deliver, potentially influencing business or departmental decision-making.
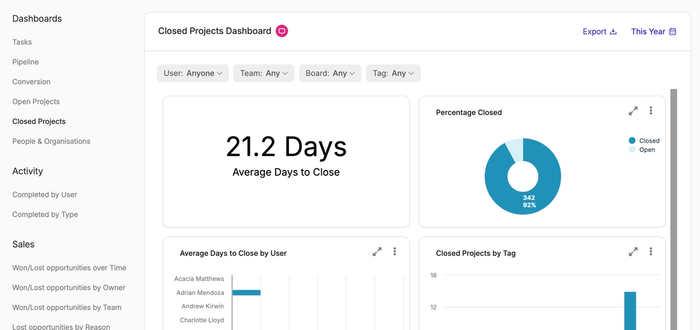
Use the delivery time and closed data to spot operational inefficiencies so you can refine your delivery processes and scale your business.

What does that look like in my business?
Let’s take a look at some examples of how you could use these in your business.
Dashboards for accounting firms
Accounting teams juggle recurring deadlines, time-sensitive compliance tasks, and a diverse client base. Capsule’s dashboards help streamline operations and strengthen client relationships.
Use the Task dashboard to track client deadlines (e.g. VAT returns, audits), ensure nothing is overdue, and balance workloads across accountants. Here, you can spot recurring delays on quarterly filings and reassign to a team member with greater availability.
Take advantage of the People & Organizations dashboard to segment clients by last contact date to keep in touch before key milestones or deadlines. This way, you can identify inactive clients before tax season to initiate check-ins and re-engagement.
You could filter the Pipeline dashboard with Tags like “Bookkeeping”, “Payroll”, or “Audit” to see where new work is coming from. This makes it easier to forecast income for seasonal services like annual accounts or year-end filings.
To sum up, Capsule’s dashboards help you to reduce late submissions, keep client communication warm, and plan for seasonal demand.
Reporting for a consultancy
Consultancies thrive on relationships, long-term projects, and repeatable outcomes – reporting dashboards offer visibility into delivery, performance, and revenue.
Using the Conversion dashboard, identify which team members and service lines (e.g. Strategy vs. Change Management) have the best conversion rates. Now you can make data-backed decisions like shifting focus to sectors or consultants with higher win rates.
Track delivery timelines and value across boards like “Client Delivery” or “Advisory” using the Open Projects dashboard. Use it to determine whether transformation projects regularly overrun while strategy projects finish faster. And if so, you can make relevant changes to your processes.
Finally, with the help of the Pipeline dashboard, you can monitor who’s keeping up with recurring client check-ins or who’s overburdened. It’s not so much an opportunity to play a blame game as it is a chance to redistribute recurring tasks or retainers to reduce burnout.
In summary, these dashboards enable you to align resources with revenue-generating services and scale delivery with more predictability.
Analysis for creative agencies
From campaign management to production timelines, creative teams need to track progress and performance across multiple clients and deliverables.
Use the Open Projects dashboard to keep a tab on deliverables by their project phase — e.g. “Concepting”, “In Review”, “Final Delivery”. This makes it easier to spot bottlenecks in the approval stage and follow up with clients faster.
The Task dashboard provides insight into workloads. Use this to assign and monitor research, strategy, and creative work across the team.
Forecast upcoming work tagged as “Branding”, “Social Campaign”, “Web Design” using the Pipeline dashboard. These reports illustrate what types of creative work are in highest demand and adjust marketing focus accordingly.
In brief, Capsule’s dashboards help you deliver creative work faster, keep client expectations aligned, and surface the projects that bring in the most value.
A clear view of your business (in the same place you manage it)
With Capsule’s new reporting dashboards, you’re no longer left guessing what’s working or where to focus next. Whether you're managing tax deadlines, running strategy projects, or delivering creative campaigns, these insights help you stay proactive, not reactive.
Each dashboard is designed to give you quick, meaningful takeaways — from tracking team performance and project delivery to spotting pipeline gaps and sales trends. And because it’s all built directly into Capsule, there’s no need to export data, switch platforms or manually piece things together. Your data stays where your work happens.
Log in to Capsule to explore your new dashboards and start making more confident, data-led decisions today.
New here? Try Capsule on for size with our free plan. Or start a 14-day trial of any paid plan and experience the full power of advanced reporting.