The Visual Pipeline
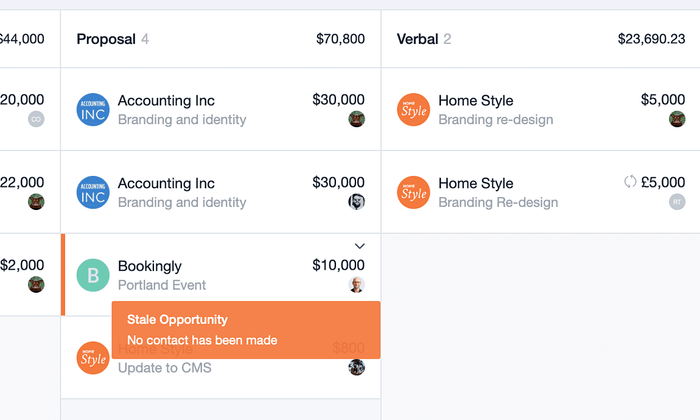
When you first go to the Sales Pipeline, you’ll see a ‘kanban’ board of all your Opportunities with a column for each of your Milestones and a card for each Opportunity. You can drag and drop an Opportunity from one Milestone column to another to change its Milestone.
From left to right, the Milestone columns are ordered by the probability of winning from 1%-99%. Then in each column, Opportunities are ordered alphabetically by the name of the contact the Opportunity is related to.
If you drag a card towards the bottom of the page then you can move it to ‘Won’ or ‘Lost’ to close the Opportunity accordingly.
Kanban - drag an opportunity to the lost button which opens Lost Reasons modal with drop down
Opportunities marked as Stale have an orange band on them and if you hover the mouse over the Opportunity you can read the reason why it is Stale.

The Sales Pipeline List
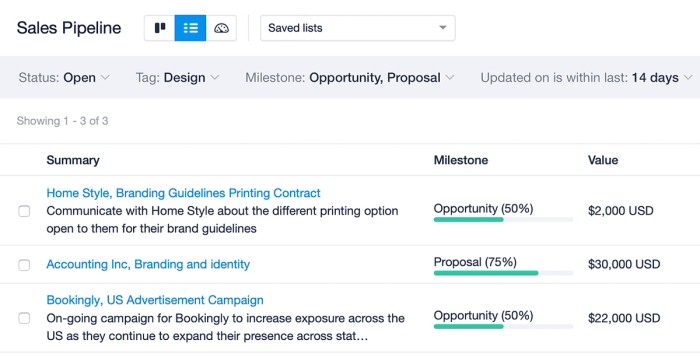
If you click on the List button then you’ll be taken to a list view where you can do more advanced filtering of your Opportunities based on a range of criteria. From this page you can filter to see just open or just closed opportunities and combine those filters with one based on your Opportunities being stale or not or when they’re expected to close. To create a list you would:
- Go to the Sales Pipeline > click on the List icon
- Either use one of the standard filters or click ‘more filters’ to select another of the available filters.
- When you’re done with a filter, click Apply and you’ll see the results update in the list immediately.
- As you add more filters they will have an implied AND between them and the results will update accordingly.

To export a list of Opportunities:
1. Navigate to Sales Pipeline
2. Choose an existing list or create a new list using your own filters
3. Select the Export button on the upper right-hand side of the list
4. On the lightbox that appears, select your column template and file type:
- CSV- CSV files are useful if you’re looking to use the file to do a mail merge or if you’re importing it into another tool.
- Excel - Excel files are better suited if you’re only looking to view, edit or share the file with other people.
5. Finally, select Export
How to use the Sales Pipeline Dashboard
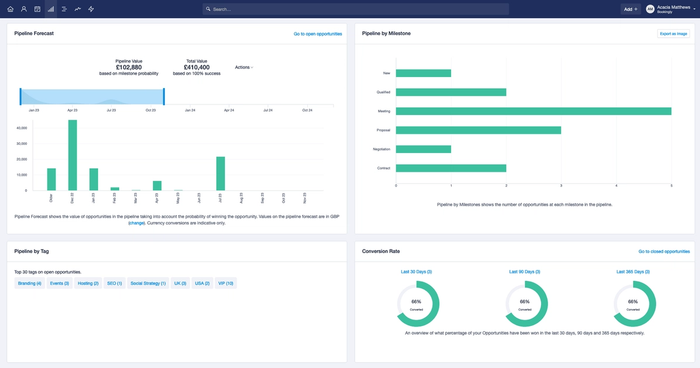
If you click on the ‘Dashboard’ icon then you get to the Sales Pipeline dashboard. It gives you an overview of how your pipeline is going. It has four components:
- Pipeline Forecast at the top left shows your forecasted sales over time. It uses the expected value on your open Opportunities based on their milestone percentage and projects that income over time based on each Opportunity’s expected close date. Use the Actions menu in the graph to export it as an image, CSV or Excel file.
- Pipeline by Tag at the bottom left shows the 30 top used tags on your Opportunities, indicating how many Opportunities there are in each tag. Click on a tag to quickly view a list of the Opportunities in that tag.
- Pipeline by Milestones in the top right shows the number of opportunities at each Milestone in the pipeline.
- Conversion Rate at the bottom right shows the percentage of Won Opportunities out of all Won and Lost Opportunities in the last 30, 90 and 365 days. Click on each heading to quickly view a list of the opportunities in that range.
