How reports can work for you
Capsule offers a number of reporting features which make it extremely easy to get insights about your business, that can help you to both optimize your sales and manage productivity. Ways you can use reports include:
- Pipeline Insights - The sales reporting in Capsule allows you to accurately forecast your upcoming sales, find leaks in your sales process and compare which users/teams are converting the most leads.
- Performance Management - Use activity reporting to gain insight into user performance and areas to improve by understanding the activities completed by each user in a particular time frame.
- New Starter Onboarding - Monitor the number of activities new starters are completing and identify if they are struggling in any areas. Having visibility of the activity notes also gives you a quick view into how they are communicating with customers and whether their approach is on-brand.
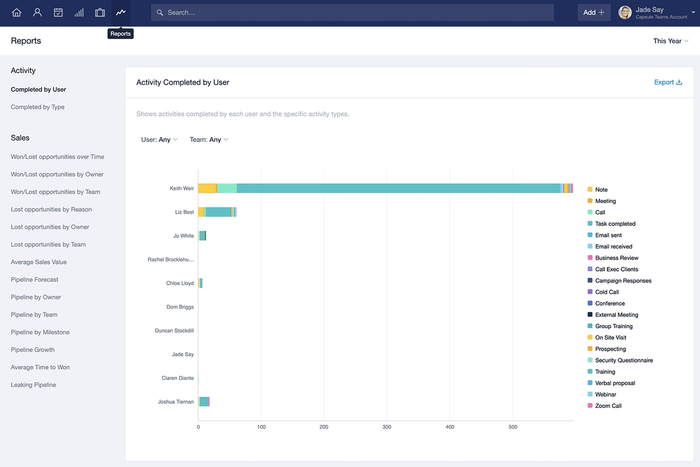
Activity and Sales Reporting can be found on the dedicated Reports page .
Understanding reports
The reports in Capsule display data for all Users on your account. You can filter reports by individual User or by Team, using the filters available at the top of the screen.
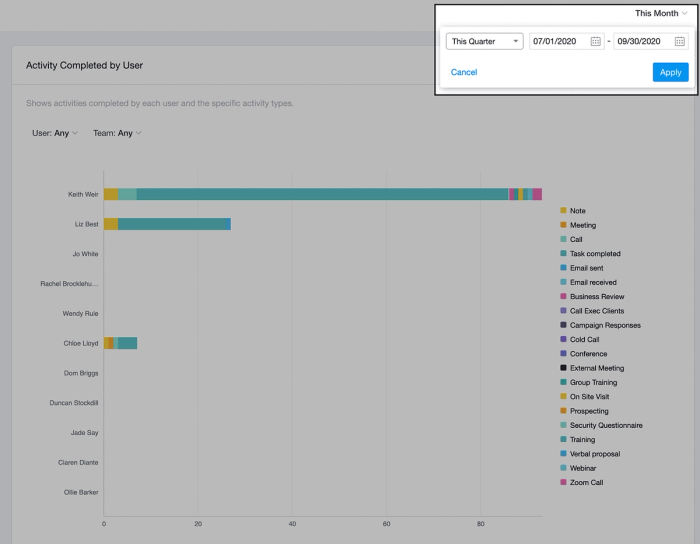
All reports can also be filtered by date. There are several standard time filters you can choose from such as a week, a month or a quarter. You can even define a custom timeframe. To filter by date, click the date picker at the top-right of the screen and select your preferred date range.
filter by name and select date range
Each of the top-level reports can be broken down to gain a deeper insight into your company’s performance. To do that, simply click on the bars within the bar chart to see a breakdown of the report. You can also click on specific rows in the results table to open up a report breakdown.
action: click on bars in chart to see breakdown
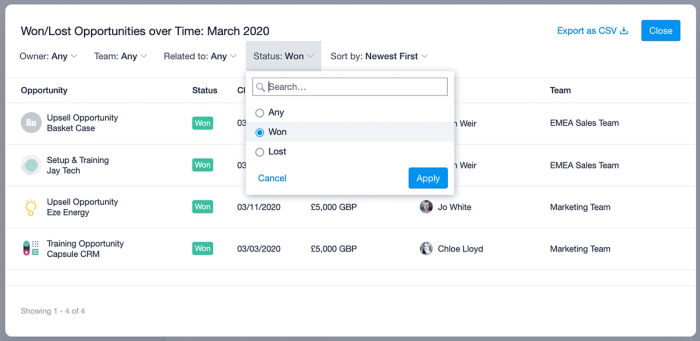
When filtering the report breakdowns, any filters applied at the point of clicking on a bar in the bar charts are automatically applied to the report breakdown. This means the breakdown reflects the selected bar. If you’d like to, you can clear and adjust these filters using the filter options at the top of the report breakdown view.
How to filter report breakdowns by date
When you view a report breakdown it uses the date filter that was applied to the top level report. If you’d like to adjust the time period the report breakdown applies to:
- Close the report breakdown view.
- Adjust the time period the report applies to using the date filters in the top right corner. You can use existing filters such as This Year and This Quarter, or you can apply a custom date range. Click 'Apply'.
- Open the report breakdown once more and the new date filter will be applied.
Time based report breakdowns such as Won/Lost Opportunities Over Time, use a combination of the top level date filter and also the month/quarter selected. For example, when the top level date filter is set to ‘This Year’, if you click on the January bar chart only Opportunities from January this year will be displayed.
Who can view reports?
The Reports page is visible to all users and each report can be viewed by all users on your account.
On plans with user access controls, all users still have access to the top level reports, however Restricted users can only view reports relating to records assigned to them. Learn more about how to control user access on the those plans.
Understanding report breakdowns and user access controls
When viewing a report breakdown, clicking a row in the report breakdown view will take you to the related task/entry for the Activity Reports and to the related Opportunities for the Sales Reports.
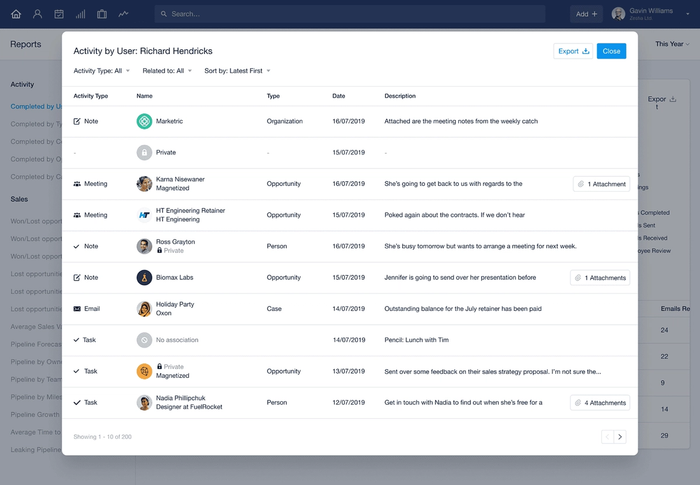
- If you do not have access to the record the activity entry relates to directly, no information will be displayed.
- If you have access to the Person the activity is recorded on but not their linked Organization, the Organization will be displayed as 'Private'.
- If you have access to an Opportunity or Project but do not have access to the linked Contact, the Contact will be displayed as 'Private'.
Filtering for lists of Opportunities
In addition to the built in Sales Reports Capsule also lets you filter for lists of Opportunities based on a range of filters to help you identify just the Opportunities you need. To create a filtered Opportunity list:
- Go to the Sales Pipeline.
- Click on the list icon
- From the list page, use one of the standard filters or click on More filters to filter for one of the many options.
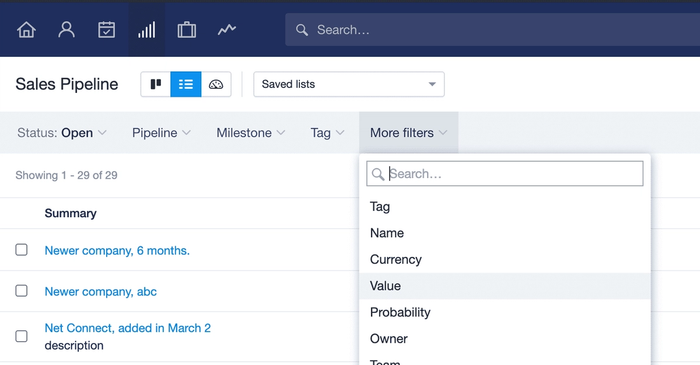
Some popular filters include:
- [Expected close On][is within next] [30] days
- [Added On][is within last] [7] days
- [Is stale][yes]
- [Value][is greater than] [10,000]
Below we go through some of the more popular reports that you can view and create.
Built in Sales Lists
Capsule has a number of standard lists you can access by going to the Sales Pipeline > Saved List:
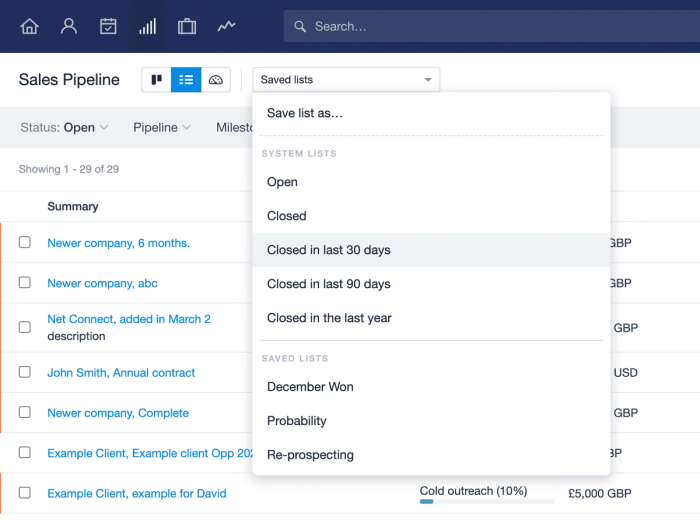
You decide how you would like to use this list. For example, you may want to export the list or tag all the Opportunities.
Finding inactive Opportunities
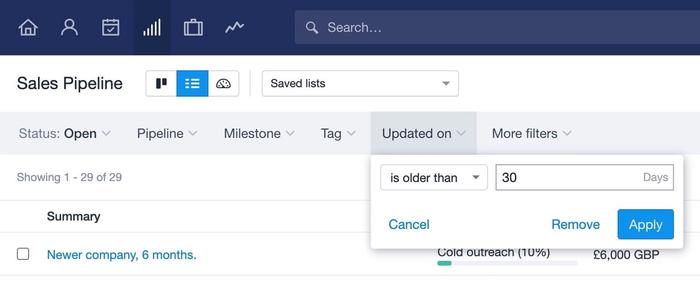
Instead of a standard list, you may wish to create your own list by adding filters. For example, creating a list for following up Opportunities that have had no action in the last 30 days:
- Go to your Sales PipelineList
- Click on More filters
- Filter for [Updated on][is older than] [30] days.
Saving a filtered List of Opportunities
To save a list for future use:
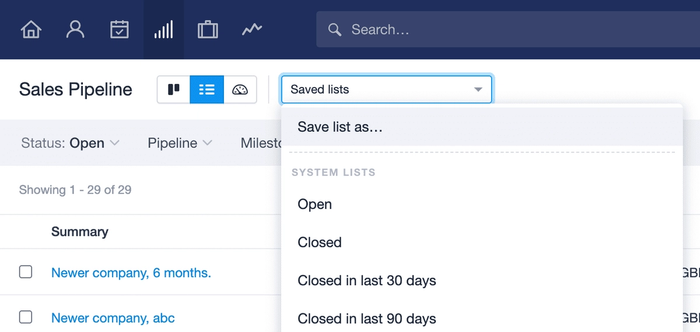
1. Click on the Saved Lists drop down menu.
2. Use the option to Save list as...
3. Name the list and then decide if you'd like the saved list to be shared with the rest of the team or just be visible to yourself.
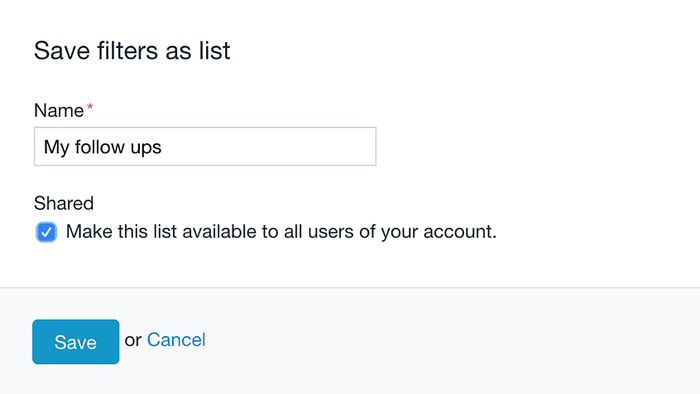
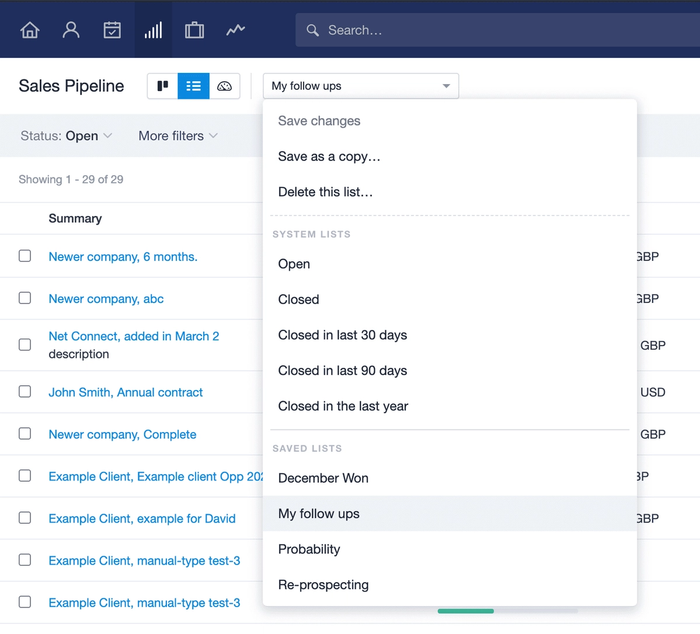
4. Click Save and you will now be able to see the saved list displayed in the drop down menu.
Find Opportunities based on their value
It can sometimes be useful to find all your Opportunities that are over a certain value. To use that:
- Go to your Sales PipelineList
- Click on More filters
- Filter for [Value][is greater than] [USD -$][10000].
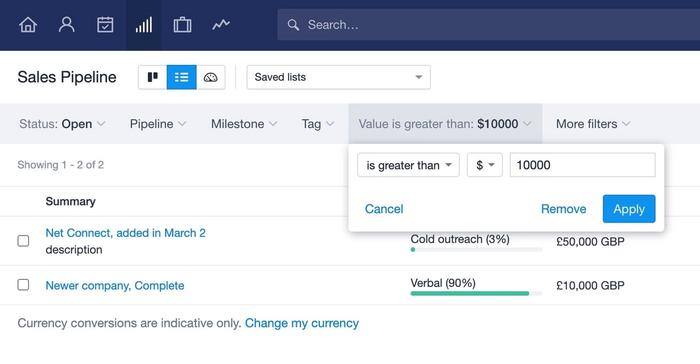
This will find all your Opportunities where the total expected value is over $10,000. That includes Opportunities that are setup with recurring revenue e.g. where the expected value is $3,000/month over 4 months.
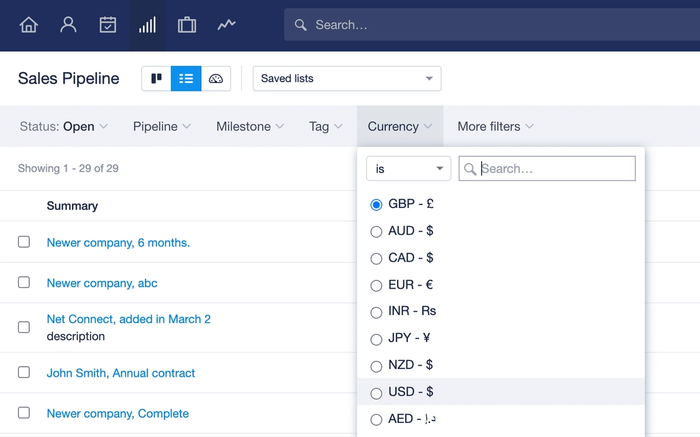
Filter Opportunities by their currency
If you're working with multiple currencies then it can also be helpful to further narrow down the list to only opportunities with a specific currency. To do that:
- Go to your Sales PipelineList
- Click on More filters
- Filter for [Currency][is] [GBP -£].
