“If you can’t measure it, you can’t improve it.”
The legend Peter Drucker's wise words that sit at the heart of every CRM.
You're likely to be measuring lots of activities and have tonnes of data in your CRM but what reports should the sales team focus on to help improve performance? Here are our top 6 recommendations.
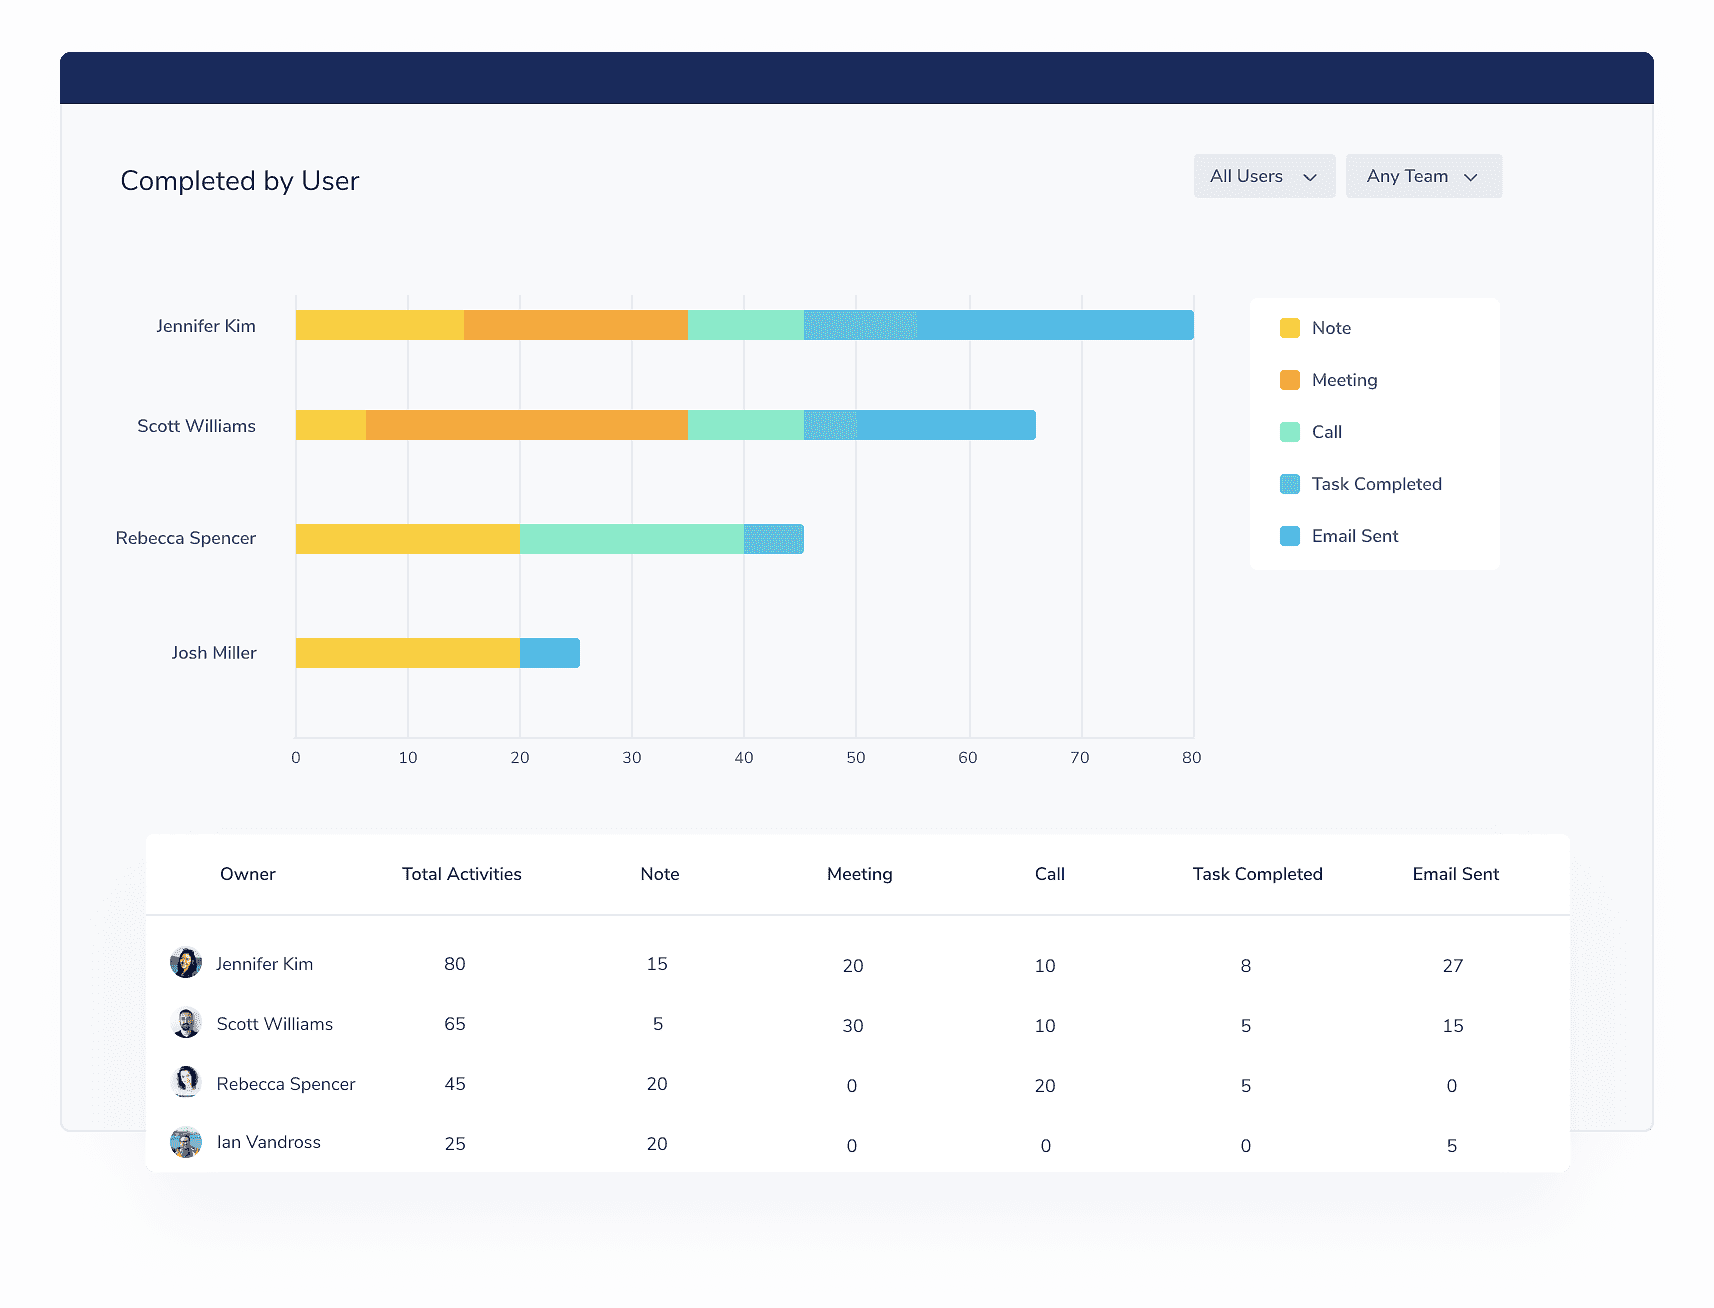
1. Sales Activity
Some believe sales is a numbers game so for them it’s important to see the activity of each sales person to help forecast the quarter or year end. The more people you contact, the more chance you have of a sale.
Even for those who value quality over quantity it’s important to see where time is being spent and comparing that to the number of sales coming in.
This report adds great value to 121 meetings too as the Sales Director can quickly see how the month is looking before they meet. The actual meeting can then be spent coaching, sharing best practice or developing new ideas to support the sales person.
When it's time to look at next year's targets, it's an incredibly useful report to help set objectives and KPIs.
Here's an example report from our Free plan.
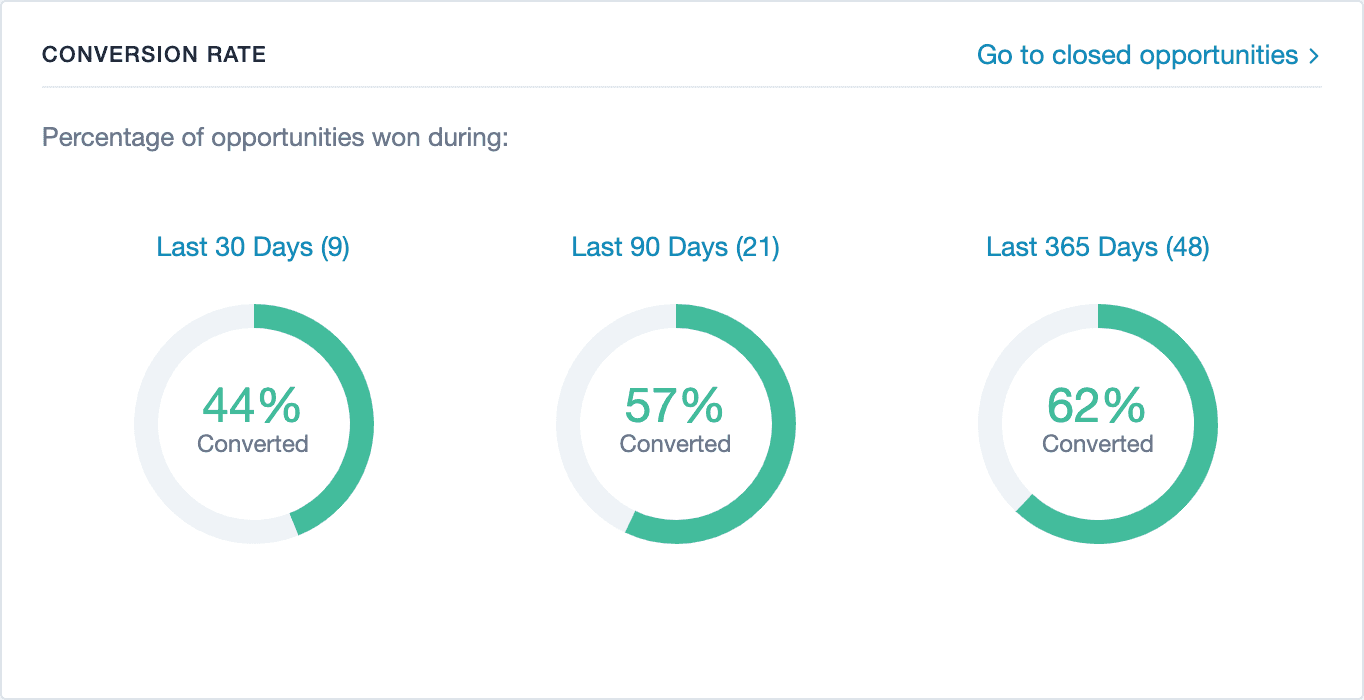
2. Conversion rate
All sales activity is about winning new business so a key report is tracking your conversion rates in the clearest, easiest way. Being able to see how many deals a sales person has secured in the last week, month and quarter is key to keeping track of business growth.
When you dig down into the data you can start to see trends. Perhaps a salesperson with a higher conversion rate uses a specific approach that resonates more with prospects or they may have more relevant marketing and PR support. When you find out what works, you can share the best practice across the team.
Here's what an overview report looks like in our Free plan.
3. Pipeline forecast
It’s key to every business to see the stage each sales opportunity is at. While the sale is only guaranteed when it comes in, it gives a good indicator to how the quarter or year is going to end.
If you monitor this weekly and spot sales are slowing down, you’ll have time to inject more marketing activity and sales support to push the figures up.
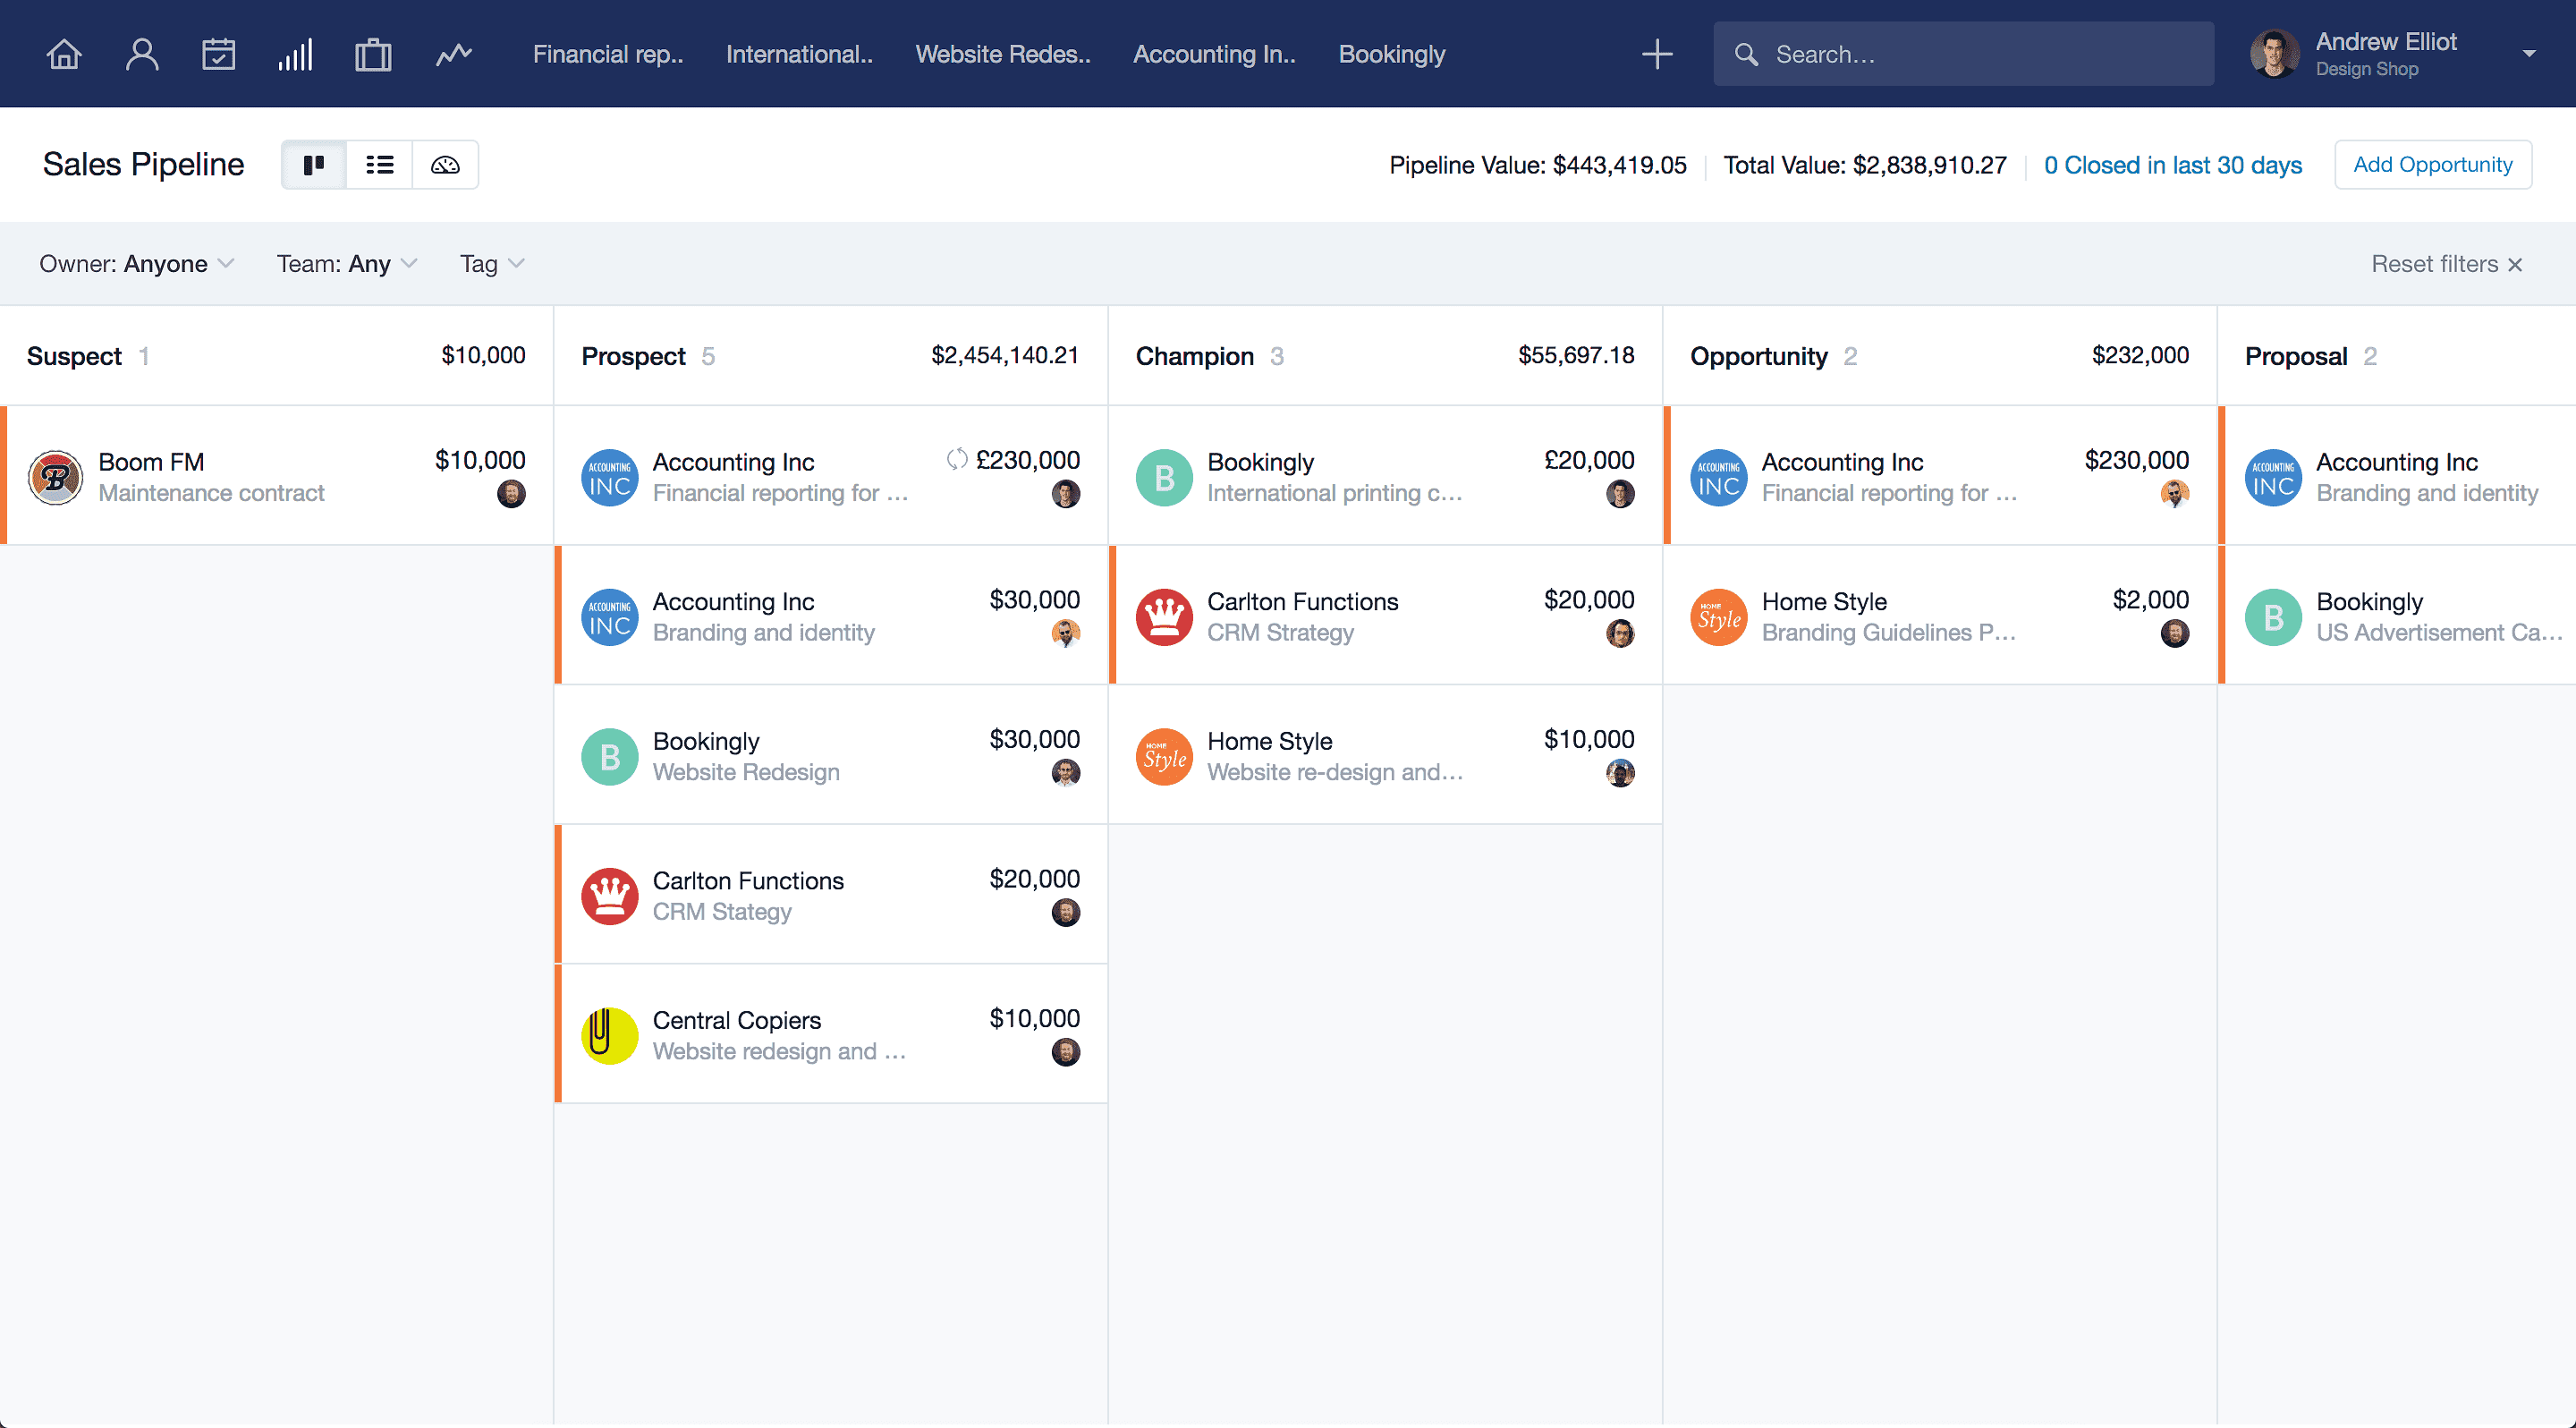
The clearer and easier the pipeline is to update and understand the more it will be used. If you can customize your pipeline to suit your business, even better.
Here’s what the Kanban style pipeline report looks like in our Free plan.
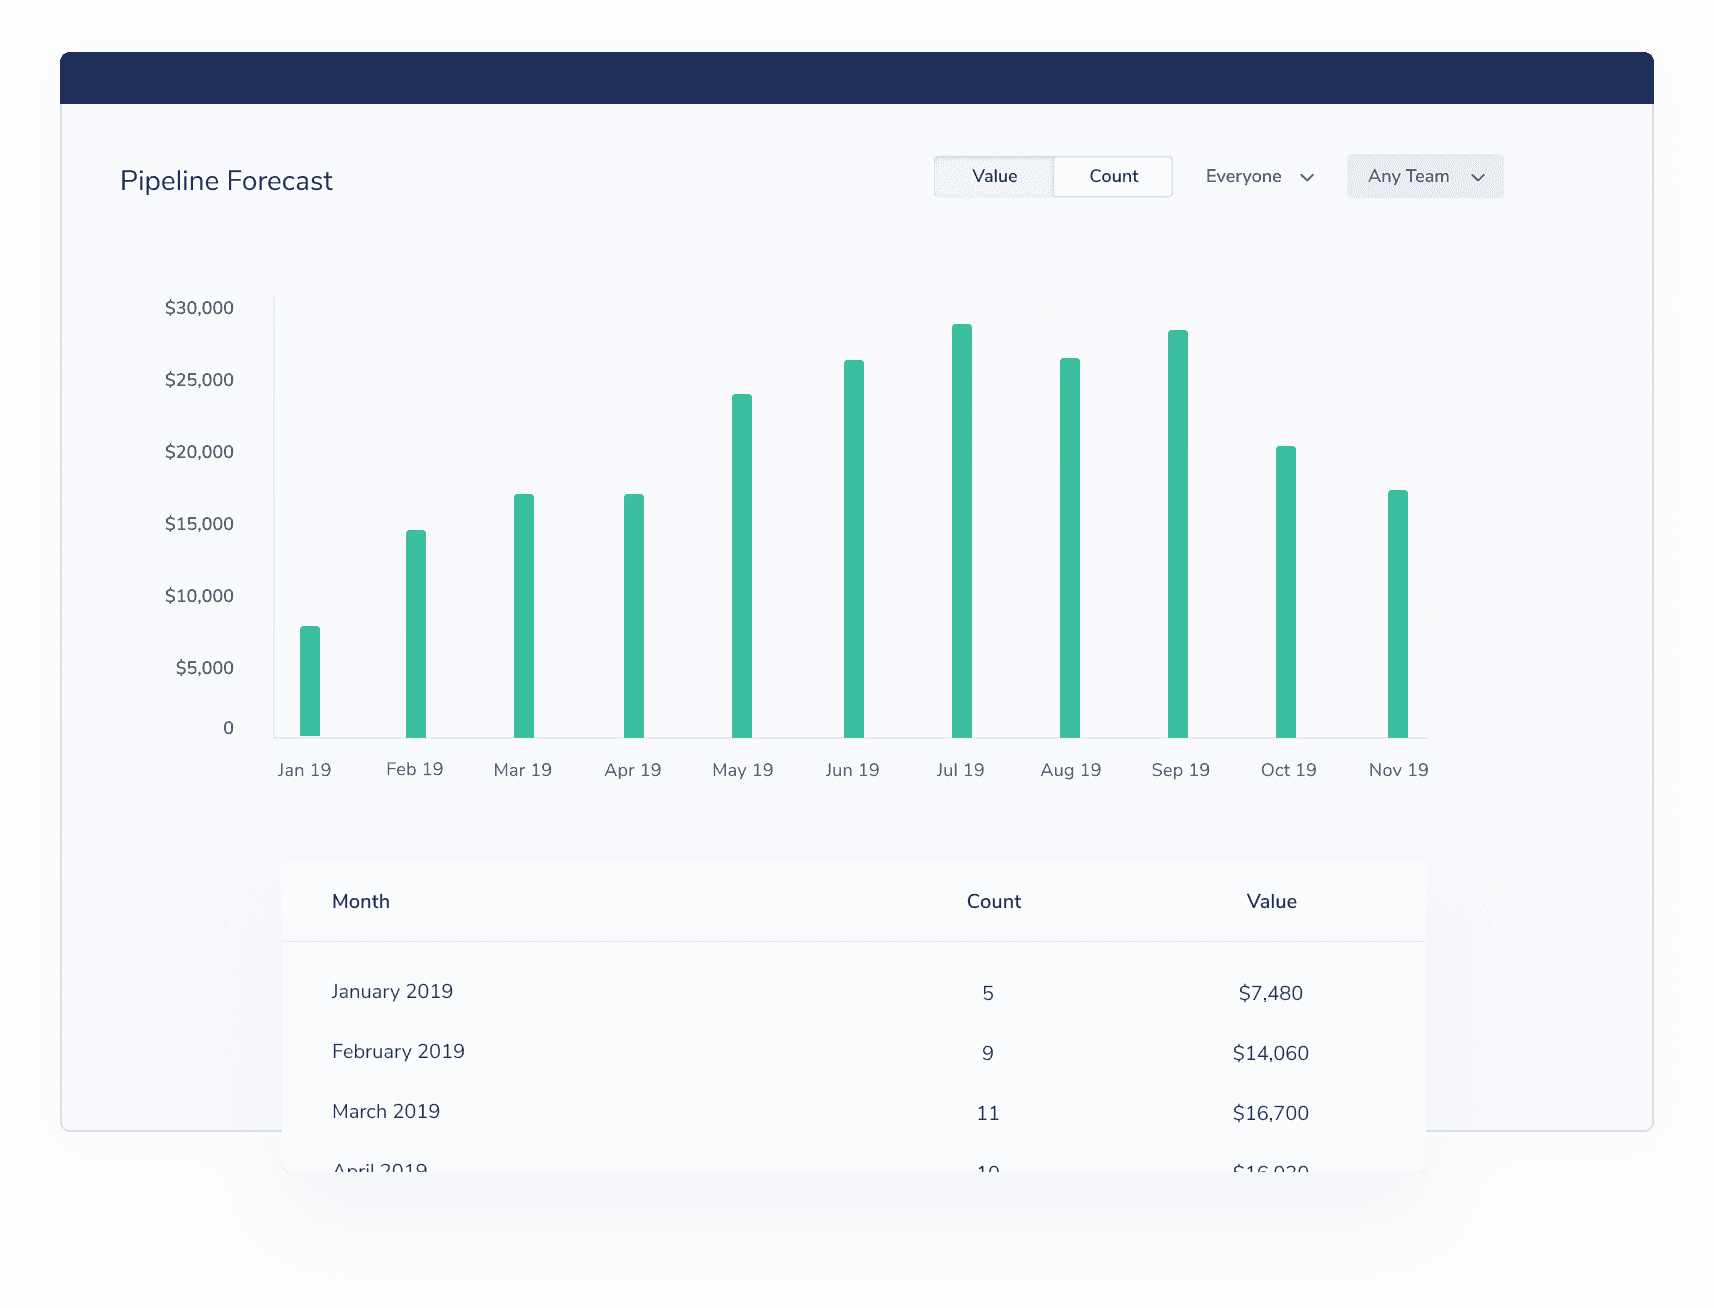
Another view is as a graph with a summary table underneath, this is how it looks in our Growth plan.
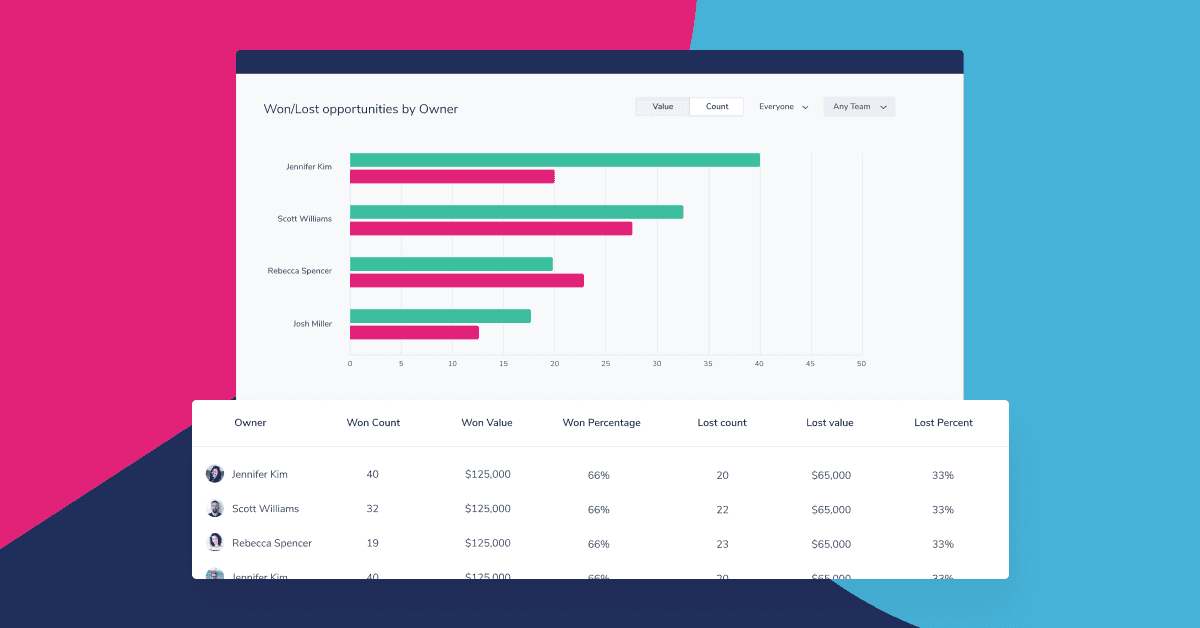
4. Leaking pipe
When sales are going great you may not delve too deep into this report but it’s worth keeping an eye on any sales you lose, no matter how small. If you don’t, a competitor might and then start to eat away at your market share.
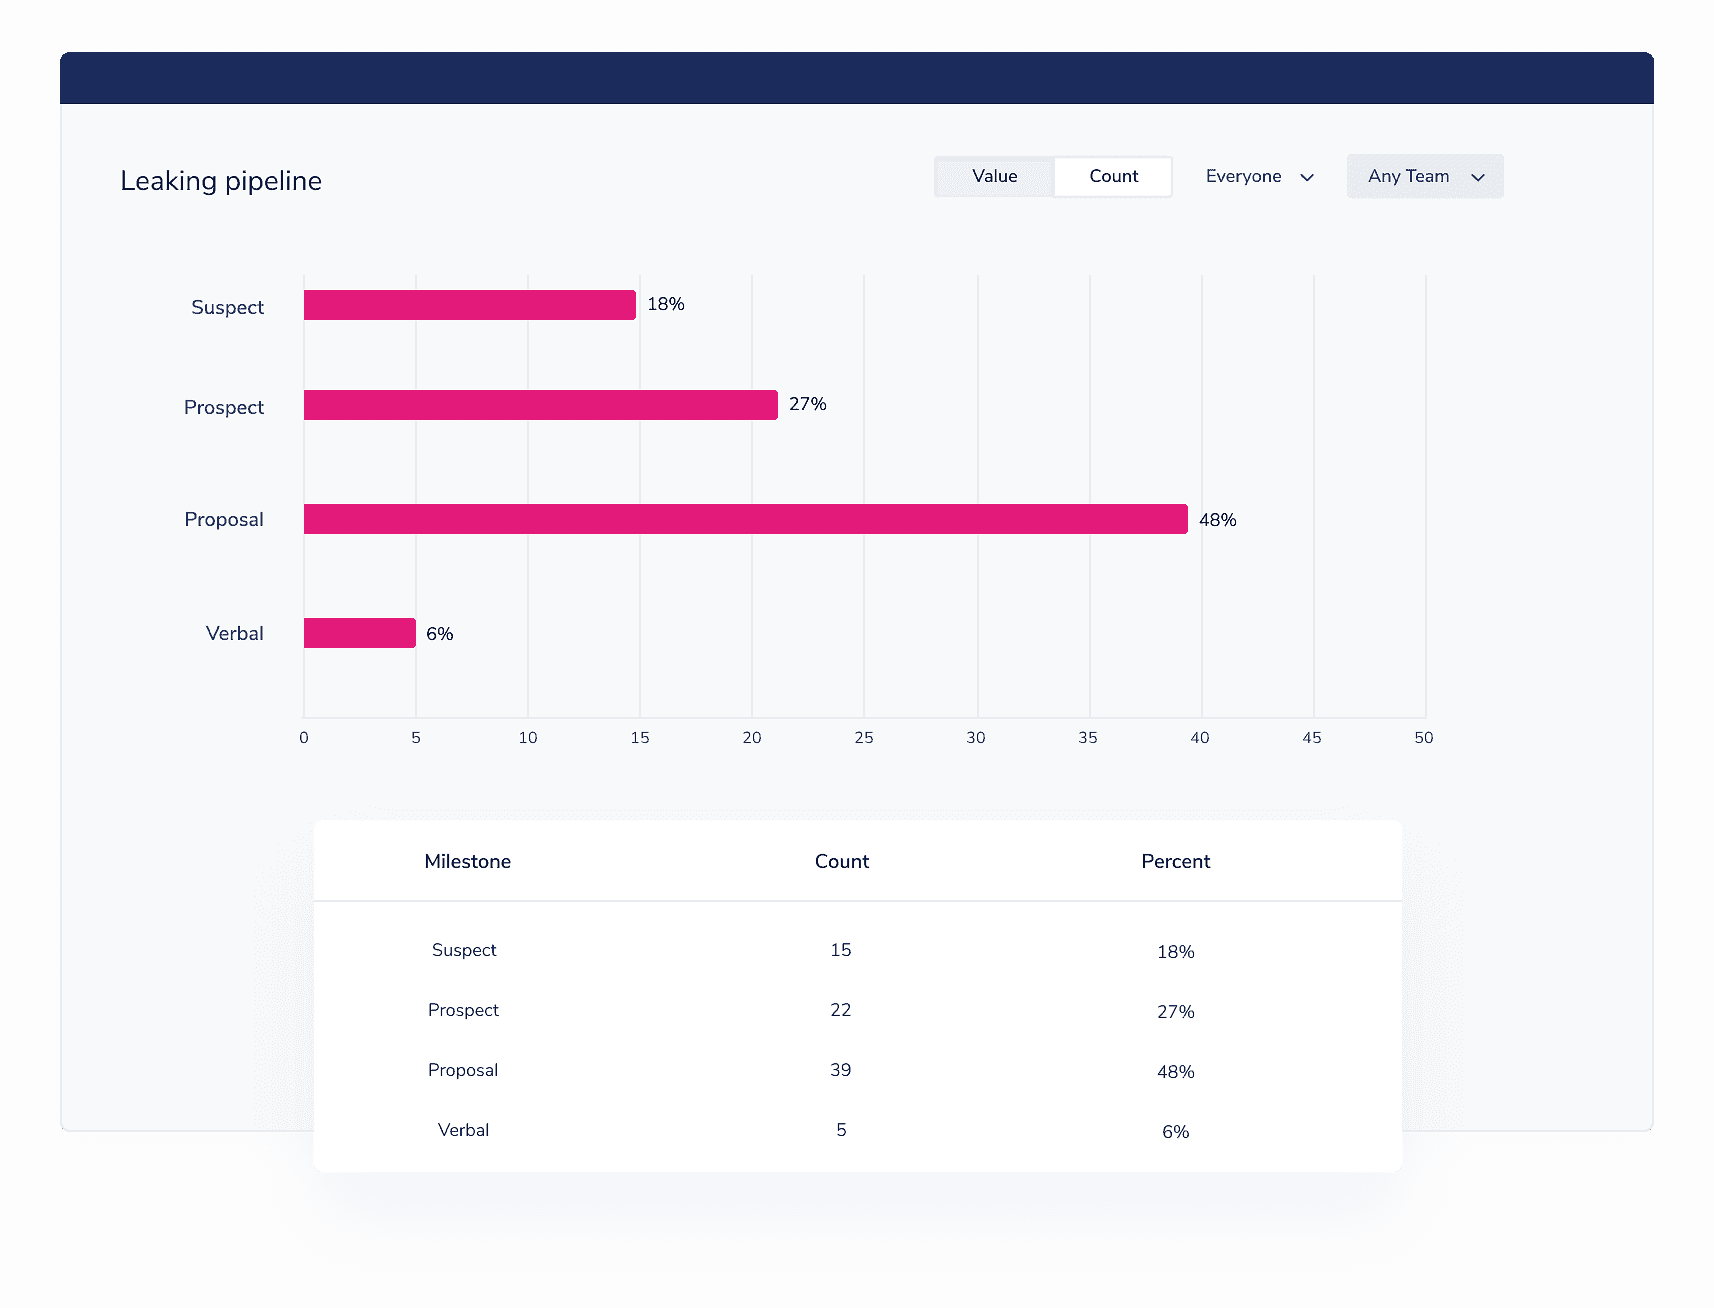
A simple report that shows the stage you lose sales is effective in the first instance.
At a top level you can spot trends with different sales people. If some are losing more than average at proposal stage you can start to think, why? Are they setting price expectations to low, could their proposals be improved or sent quicker? Once you find out, you can fix before it becomes a bigger issue. This is how the report looks in our Growth plan.
5. Lost reasons
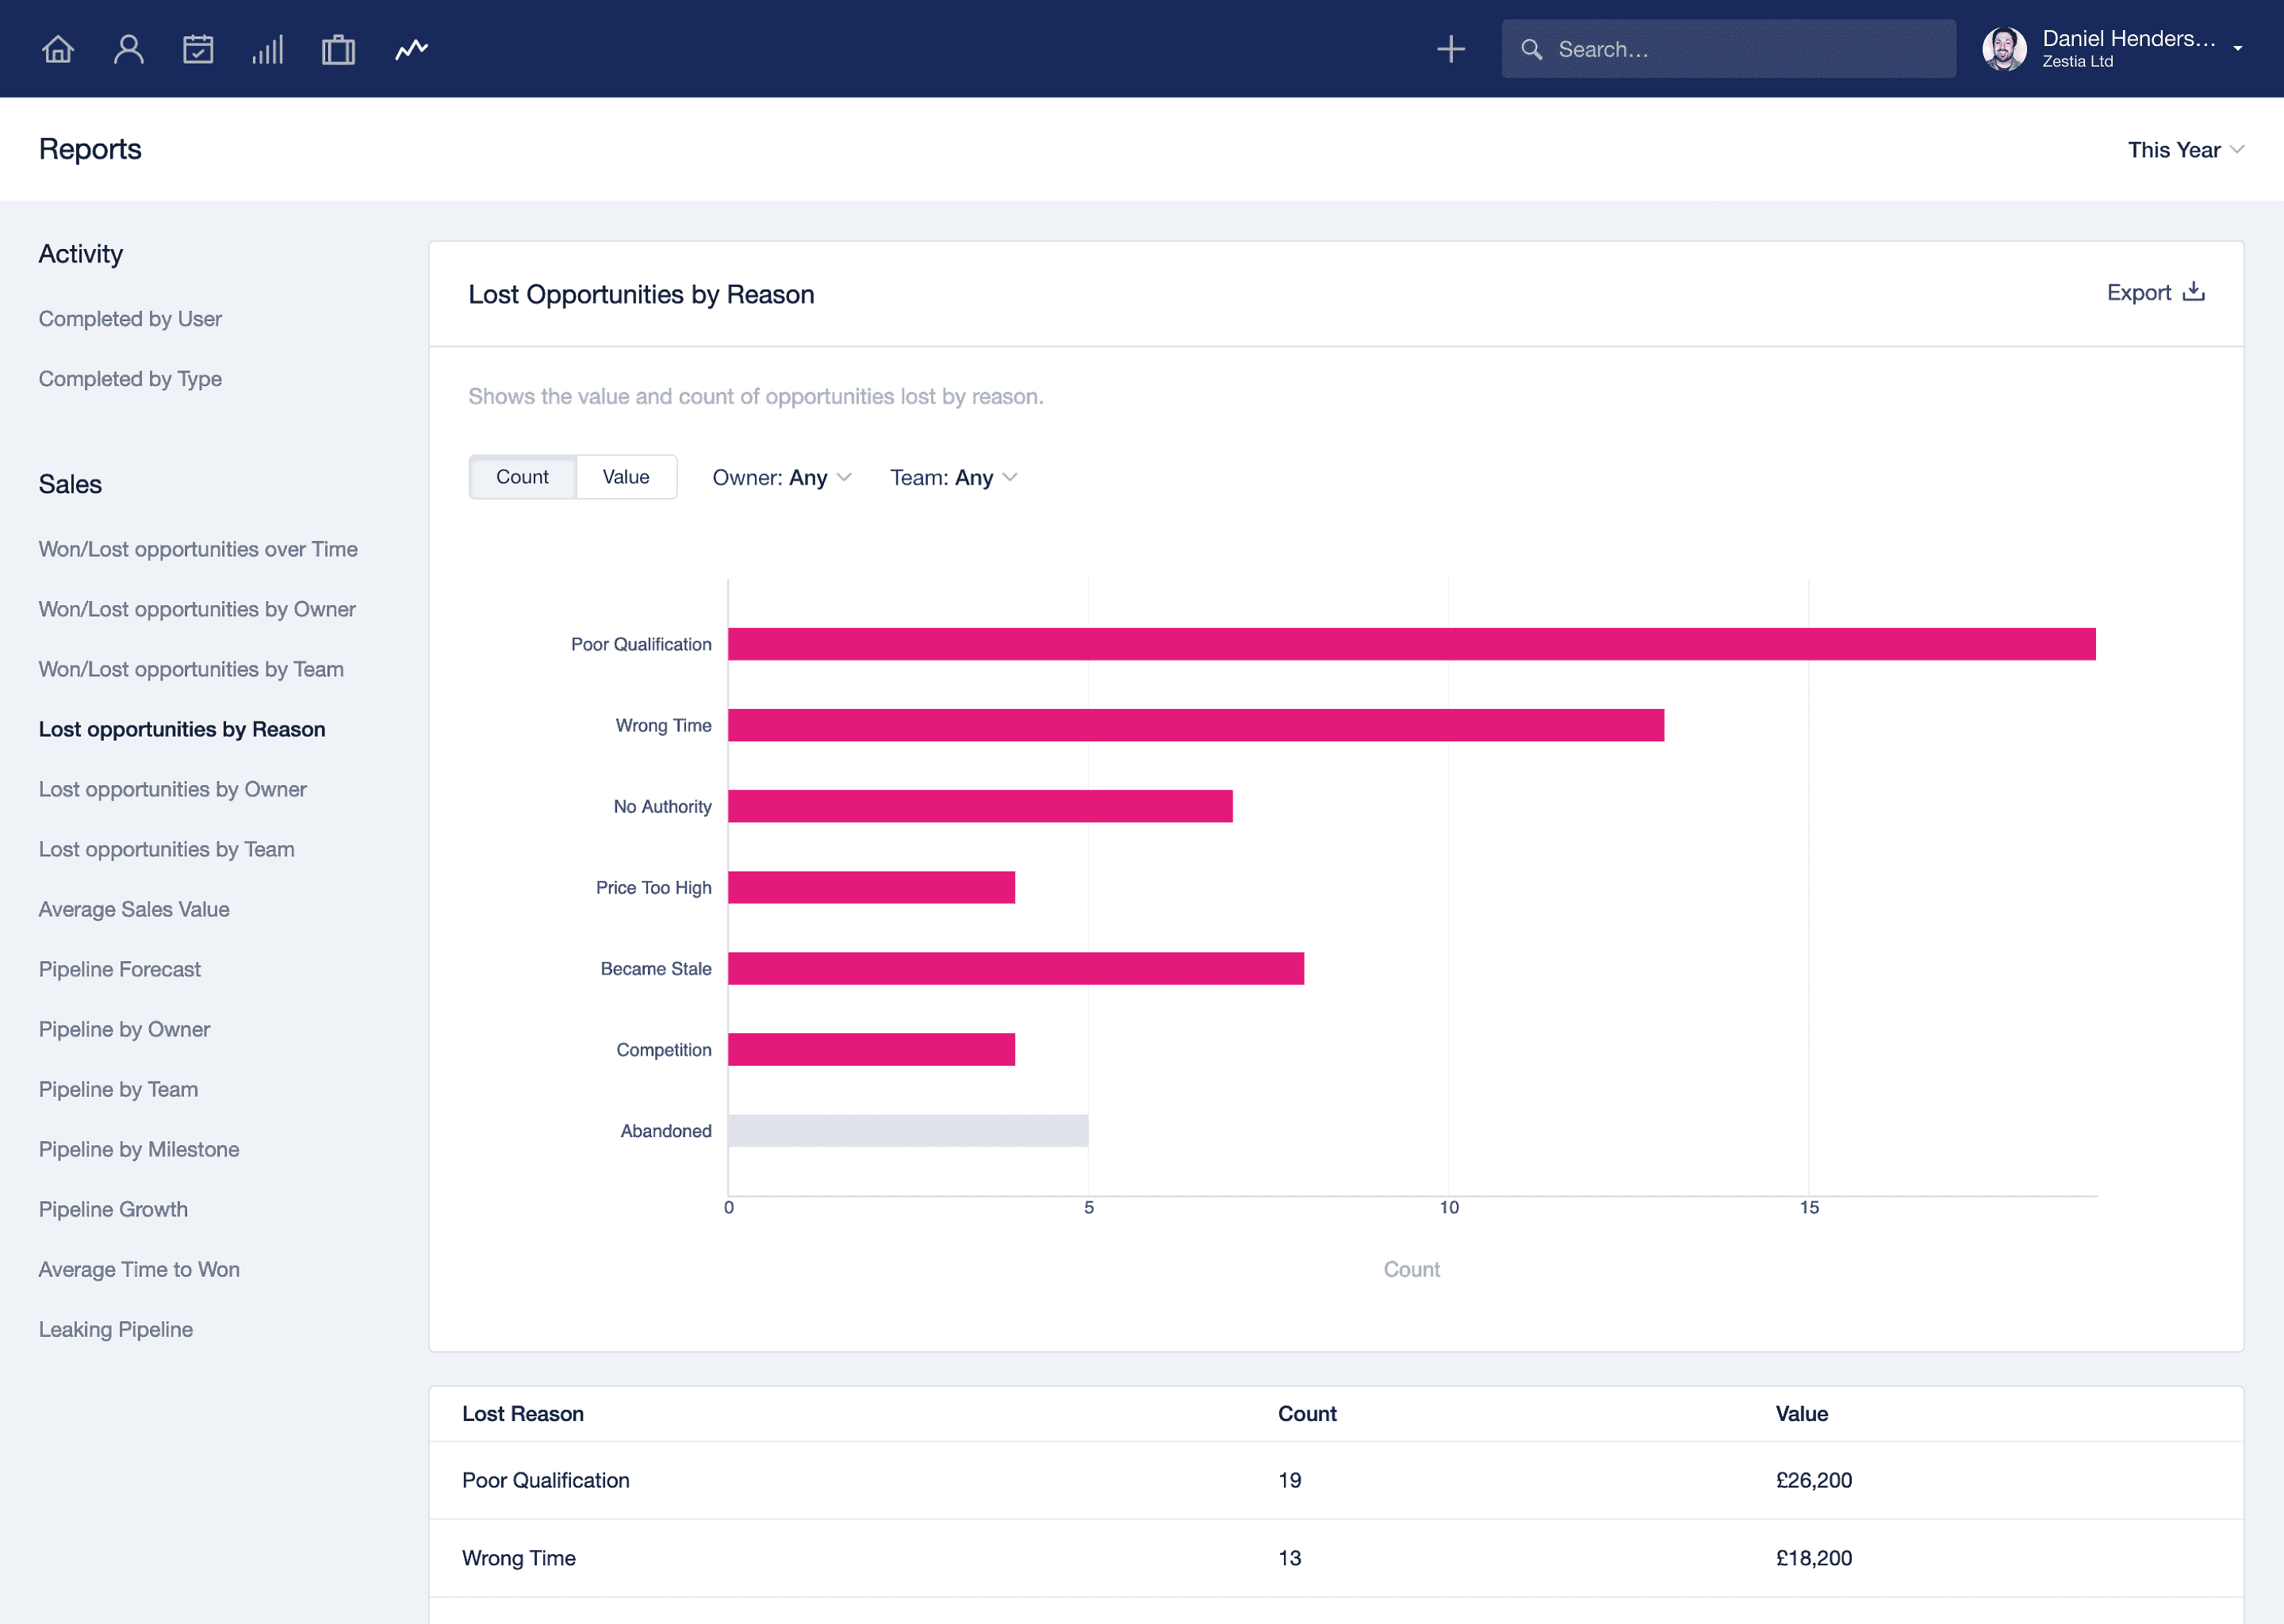
To find out exactly why you’re losing sales, this report is key. By asking the simple question, ‘why’ when a sale is lost and recording it in the CRM, will give you incredible insight.
You can learn from every lost sale. You may lose out simply because the competitor was a friend of the decision maker so you learn that relationships are important in that business or industry. Perhaps more time should be spent analyzing your connections to capitalize on established relationships or do more networking and face to face activity.
The great thing with lost reasons is when you track them, you can spot trends and take action quickly before they have a big impact on your sales figures.
Here’s how the report looks in our Growth plan.
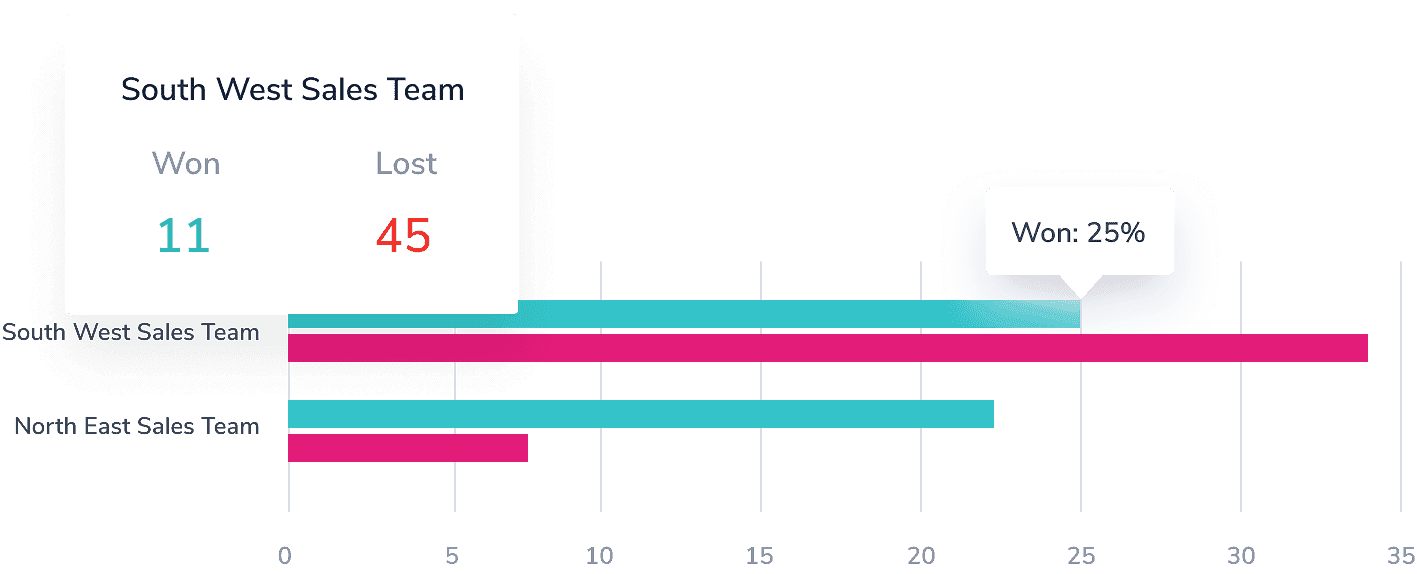
6. Team sales performance
When managing multiple sales teams it’s handy to have a birds eye view of how each region or country is operating in comparison with one another. It helps when allocating marketing budgets and sales effort before it’s too late.
It’s also a fantastic motivational tool as most sales teams enjoy a bit of healthy competition - especially if there’s a top team award for the winners!
Here’s how the report looks in our Growth plan.
And for everything else there's Google data studio. If you've not yet checked out this phenomenal tool, you should. It's an easy way to drill down into your data and create some useful reports that may not be available in your CRM. Here’s what we created quickly in Google Data Studio earlier this year.
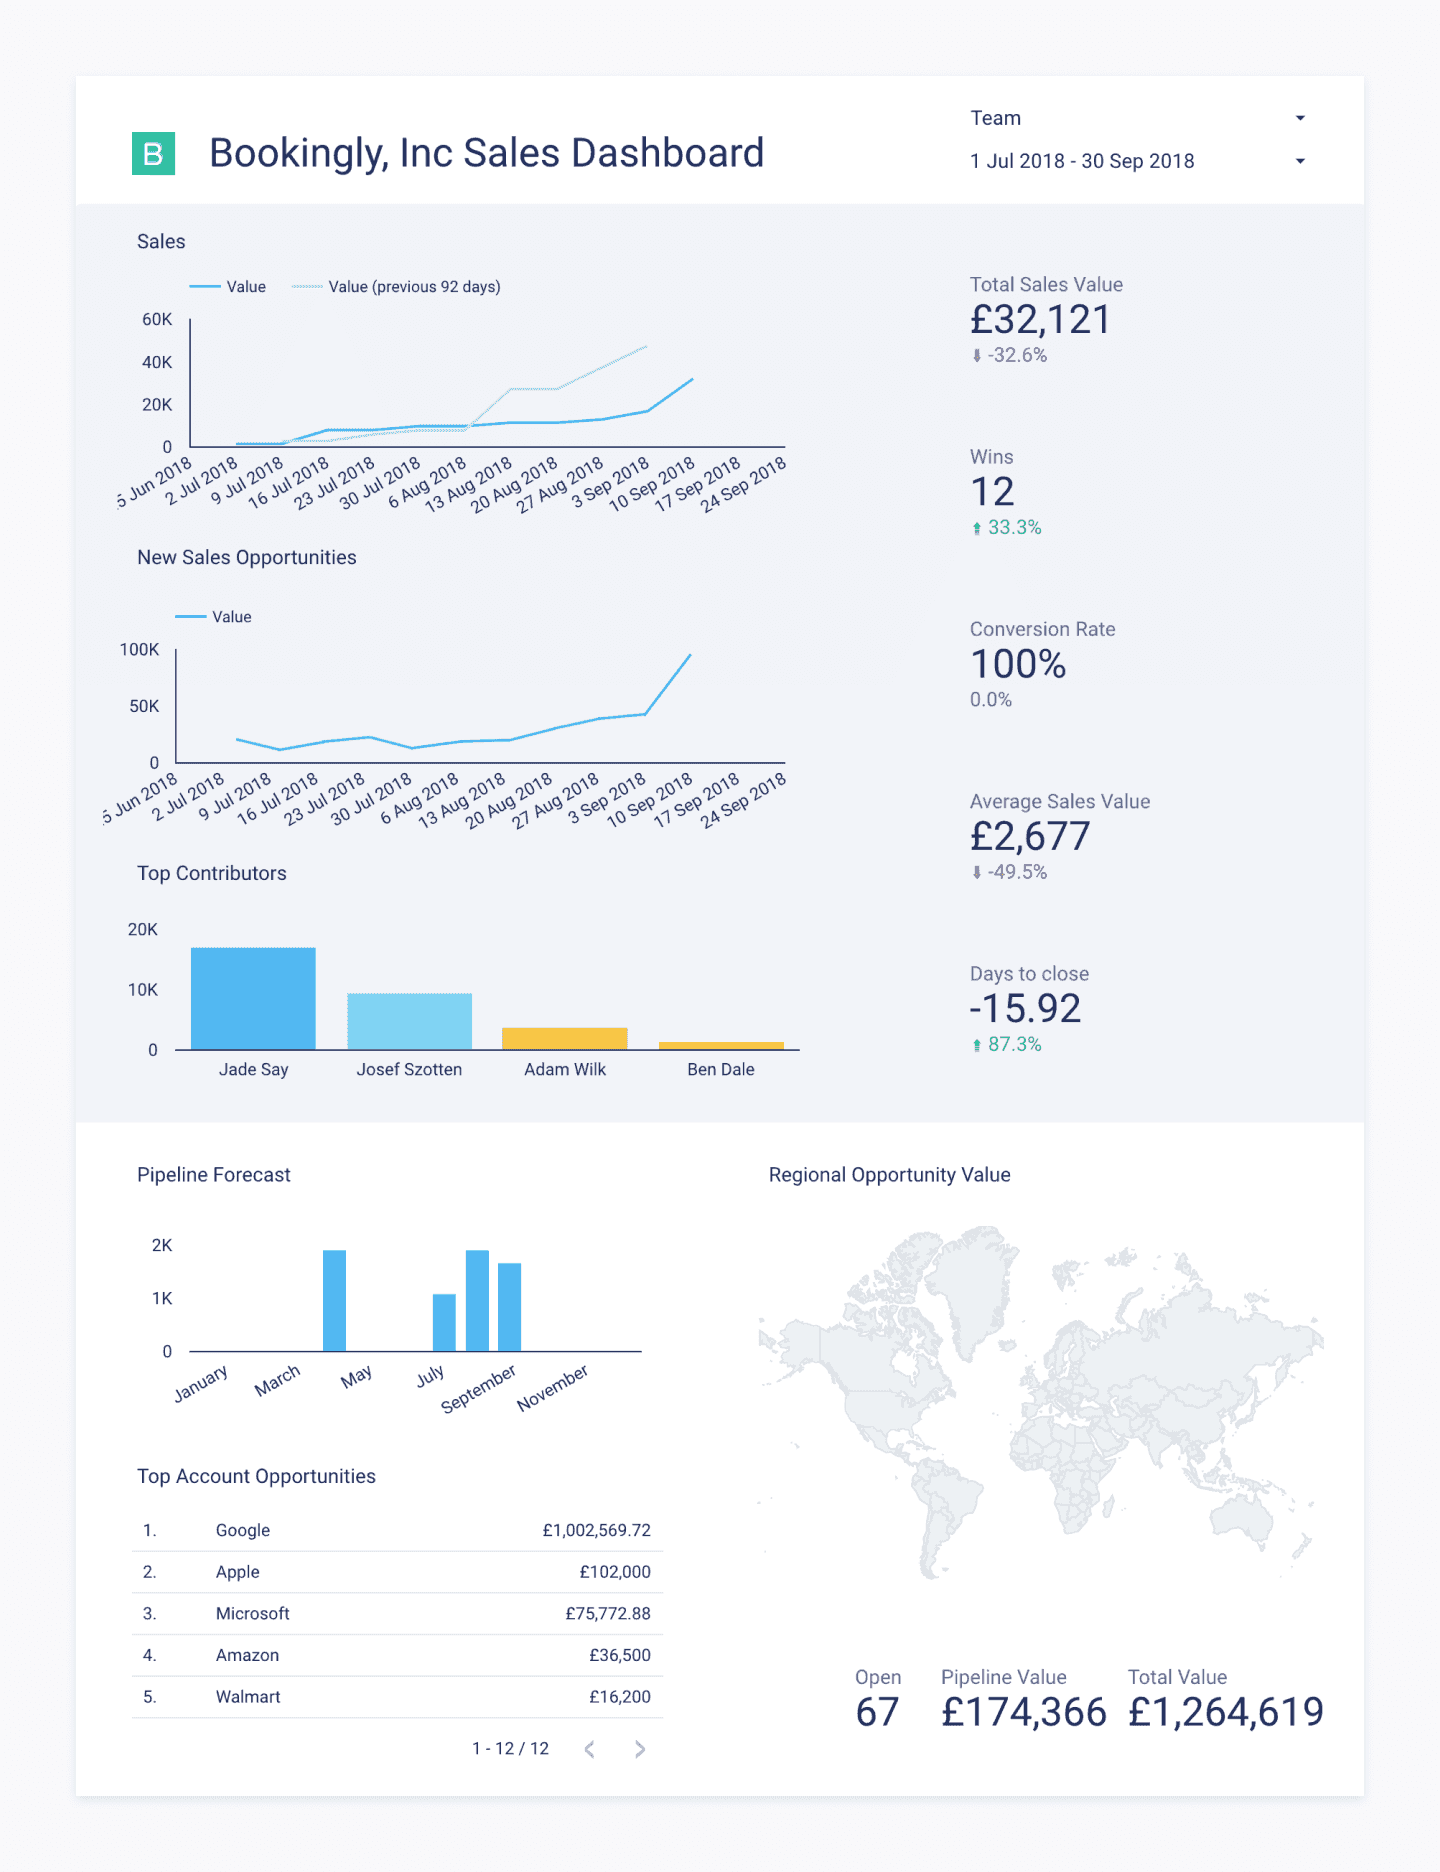
The more you analyze your data, the more you’ll increase your sales. And if your CRM doesn’t have the report you like you can see if Google Data Studio can help.